Too Much Light, Not Enough Visibility: Rethinking How Enterprise Teams Instrument Their Systems
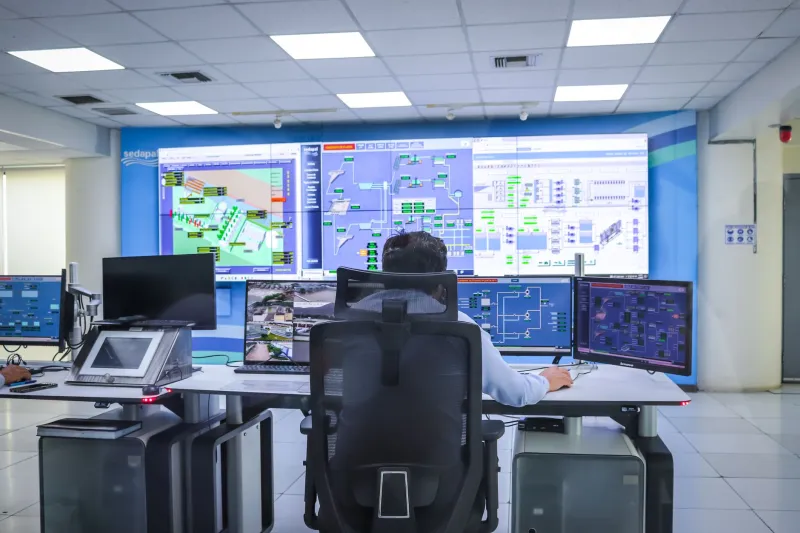
There is a version of this story that plays out with remarkable consistency across enterprise engineering organizations. A significant incident occurs. The postmortem reveals that the relevant signals were present in the monitoring stack—buried somewhere in a dashboard that nobody was watching, or aggregated in a way that obscured the anomaly, or simply lost in the volume of alerts that had been firing so continuously that the on-call engineer had learned to discount them.
The response, almost invariably, is to add more instrumentation. More metrics. More dashboards. More alerting rules. The implicit logic is that the incident occurred because something was not being measured, and the solution is to ensure that nothing escapes measurement going forward.
This logic is understandable. It is also, in many cases, precisely wrong.
The Instrumentation Accumulation Problem
Observability tooling has become significantly more capable and significantly more accessible over the past several years. Platforms like Datadog, Honeycomb, Grafana, and their enterprise counterparts make it straightforward to instrument systems comprehensively, collect high-cardinality telemetry, and build dashboards at a pace that would have been impractical a decade ago. The marginal cost of adding a metric or a trace has dropped substantially.
What has not dropped is the cognitive cost of interpreting that data under pressure. When an incident occurs, the engineer responding to it is working against time, often outside business hours, with incomplete context about which of the hundreds of available signals are relevant to the specific failure mode they are trying to diagnose. The abundance of data that seemed like an asset during planning becomes a liability during response.
This is the observability paradox: the investment that was intended to accelerate diagnosis can, when applied without strategic discipline, slow it down. More dashboards mean more places to look. More alerting rules mean more noise to filter. More metrics mean more potential explanations to evaluate before the correct one surfaces.
The research on this dynamic in adjacent domains—emergency medicine, air traffic control, financial trading—is consistent. Beyond a certain threshold, additional information does not improve decision quality under time pressure. It degrades it. Enterprise observability practices have not yet fully internalized this finding.
Monitoring Volume Versus Diagnostic Clarity
The distinction between monitoring volume and diagnostic clarity is worth examining carefully, because it is easy to conflate the two.
Monitoring volume is a measure of how comprehensively a system is instrumented. High-volume monitoring means that many metrics are being collected, many events are being logged, and many traces are being captured. It is a reasonable proxy for observability investment, and it is the metric most commonly cited in vendor conversations and platform evaluations.
Diagnostic clarity is a different property entirely. It describes the degree to which the available telemetry enables an engineer to move from anomaly detection to root cause identification in a constrained time window. A system can have very high monitoring volume and very low diagnostic clarity—and this combination is more common than the observability industry tends to acknowledge.
Diagnostic clarity depends not on the quantity of signals but on their organization. Specifically, it depends on whether the telemetry architecture reflects an explicit model of how the system fails, rather than an implicit assumption that comprehensive coverage will surface failures automatically.
Systems fail in structured ways. They have known failure modes—dependency timeouts, resource exhaustion, configuration drift, data quality degradation—and those failure modes tend to manifest through specific combinations of signals. Observability strategies designed around these failure mode hypotheses produce telemetry that is immediately actionable when an incident occurs. Observability strategies designed around comprehensive coverage produce telemetry that requires interpretation before it can be acted upon.
The Alert Fatigue Compounding Effect
Alert fatigue deserves particular attention because it represents a case where observability investment actively degrades operational capability.
When alerting thresholds are set conservatively—as they often are, in the aftermath of incidents where a signal was missed—the resulting alert volume tends to exceed the capacity of on-call teams to investigate each notification meaningfully. Engineers develop heuristics for triaging alerts, and those heuristics inevitably involve discounting categories of alerts that have historically been noisy. This is rational individual behavior that produces irrational organizational outcomes: the monitoring infrastructure continues to fire alerts that nobody investigates, creating a false sense of coverage while the actual signal-to-noise ratio deteriorates.
Recovering from this state requires organizational willingness to reduce alert volume, which is psychologically difficult because it feels like accepting reduced coverage. The engineers who would need to approve alert suppression are often the same engineers who added those alerts in response to previous incidents. Removing them requires trusting that the remaining signals are sufficient—a trust that is hard to establish without empirical evidence about which alerts have historically been actionable.
How High-Performing Teams Structure Their Telemetry
Organizations that maintain effective observability at scale tend to approach instrumentation as an architectural discipline rather than a coverage exercise. Several practices distinguish their approach.
First, they instrument around user-visible outcomes rather than internal system states. Rather than attempting to monitor every component exhaustively, they define the behaviors that matter to end users—latency, error rates, availability—and instrument those outcomes directly. Internal signals are then selected based on their demonstrated correlation with degradation in user-visible outcomes, rather than their theoretical relevance.
Second, they maintain explicit failure mode catalogs. These are living documents that describe the known ways a system can fail, the signals that indicate each failure mode, and the response procedures associated with each. Instrumentation decisions are evaluated against this catalog: signals that illuminate known failure modes are prioritized; signals that add coverage without corresponding to a specific failure hypothesis are treated with skepticism.
Third, they invest in alert quality over alert quantity. This means accepting that some failures will not be detected automatically, in exchange for ensuring that the alerts that do fire are consistently actionable. High-performing on-call teams tend to have significantly fewer active alerting rules than their peers—and significantly faster mean time to resolution.
Finally, they treat observability infrastructure as a product with its own users. The engineers who respond to incidents are the customers of the monitoring stack, and their feedback about signal quality, dashboard usability, and alert accuracy is treated as primary input into instrumentation decisions.
The Strategic Reframe
The enterprise observability conversation has been dominated, for too long, by the language of completeness. The goal has been framed as seeing everything—capturing every metric, tracing every request, logging every event.
Completeness is not the right goal. Clarity is. The organizations that respond to incidents most effectively are not the ones with the most comprehensive telemetry. They are the ones whose telemetry is most deliberately organized around the specific ways their systems fail and the specific decisions their engineers need to make when failures occur.
More light, applied without direction, does not improve visibility. It produces glare.